Basic HPGeom Interface
Getting Started
HPGeom is a lightweight implementation of HEALPix geometry functions, wrappedin a numpy interface. The implementation is based on the geometric functions in the original HEALPix C++ library code. HPGeom has an all-new API, but there are compatibility functions with the same interfaces as healpy for easy transition from healpy to HPGeom.
Because HPGeom contains only geometric routines, there are no facilities for reading or writing HEALPix maps, nor are there any visualization routines. Furthermore, there are no spherical harmonic functions which operate on full maps. For reading and writing maps efficiently, please consider using HealSparse. For visualization of HEALPix and HealSparse maps, please consider using SkyProj.
The tutorial examples here assume matplotlib has been installed, for simple visualizations and usage examples. However, matplotlib is not required for any HPGeom functionality.
Key Differences Between healpy and HPGeom
There are a few key differences between the healpy and HPGeom interfaces that a user familiar with healpy should be aware of. These include:
The default ordering scheme in HPGeom is
nestrather thanring. This is because the heirarchicalnestordering scheme is more natural when using HEALPix as a geometry library (whileringis more natural when computing spherical harmonics). To override the default, the keywordnest=Falsecan be applied to all relevant functions.The default angular coordinates for HPGeom are longitude and latitude, expressed in degrees, rather than co-latitude and longitude in radians. Longitude and latitude will be in degrees if the keyword
degrees=True(the default), and otherwise will be in radians. Angular coordinates will be in units of co-latitude (theta) and longitude (phi) if the keywordlonlat=Falseis used. Note that theta/phi are always in radians.For many routines which return multi-dimensional arrays, such as
hpgeom.boundaries(), the output ordering is the transpose of the healpy output format, such that it returns an array of shape(N, 4*step,). This ordering requires fewer moves of data in memory for the default numpy memory ordering.
Conversion Between Angles and Pixels
The simplest operation is the conversion between angles and pixels. As noted above, this will return the pixel values in the nest ordering scheme by default. The interface looks like:
import hpgeom as hpg


nside = 2048
lon = np.arange(10, dtype=np.float64)
lat = np.arange(10, dtype=np.float64)
pixels_nest = hpg.angle_to_pixel(nside, lon, lat)

pixels_ring = hpg.angle_to_pixel(nside, lon, lat, nest=False)
# or
pixels_ring = hpg.nest_to_ring(nside, pixels_nest)
And to do the reverse operation, we simply do:
import hpgeom as hpg


nside = 2048
pixels_nest = np.arange(10)
lon, lat = hpg.pixel_to_angle(nside, pixels_nest)

theta, phi = hpg.pixel_to_angle(nside, pixels_nest, lonlat=False)
# or
theta, phi = hpg.lonlat_to_thetaphi(lon, lat)
Pixel Queries
There are several routines in HPGeom to query for pixels contained within various shapes.
These routines follow the same inclusive algorithm as healpy, and use the same over-sampling method to estimate which pixels may overlap with a given shape.
This algorithm is designed to possibly return extra pixels, depending on the fact parameter.
The overlap test is performed at a resolution fact*nside.
For nest ordering, fact must be a power of 2, and nside*fact must always be <= 2**29.
For ring ordering, fact may be any positive integer.
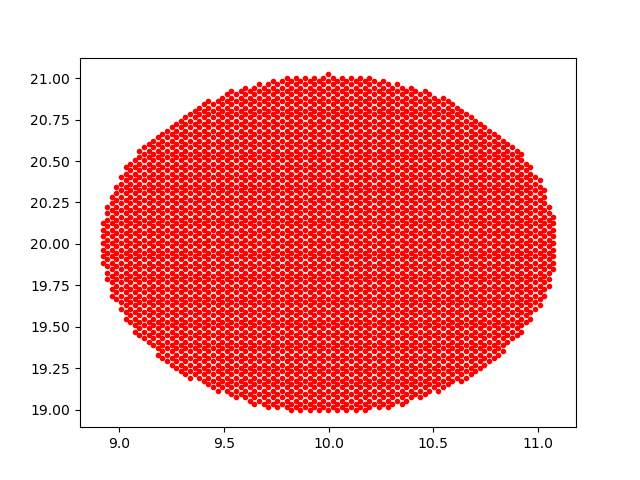
The HPGeom query_circle() function behaves much the same as the healpy query_disc().
It returns pixels whose centers lie within the circle defined by the central coordinate and radius if inclusive=False, or which overlap with the circle if inclusive=True.
A key difference is that hpgeom.query_circle() takes as input spherical coordinates rather than unit-vector coordinates.
Note that this function is more efficient with ring ordering, though it is often faster overall to use nest ordering directly rather than do the query with ring ordering and convert to nest.
import hpgeom as hpg
import matplotlib.pyplot as plt


# Return all pixels within 1 degree of lon=10 degrees, lat=20 degrees,
# including all pixels with partial coverage.
pixels = hpg.query_circle(2048, 10.0, 20.0, 1.0, inclusive=True)
lon, lat = hpg.pixel_to_angle(2048, pixels)

plt.plot(lon, lat, 'r.')
plt.show()
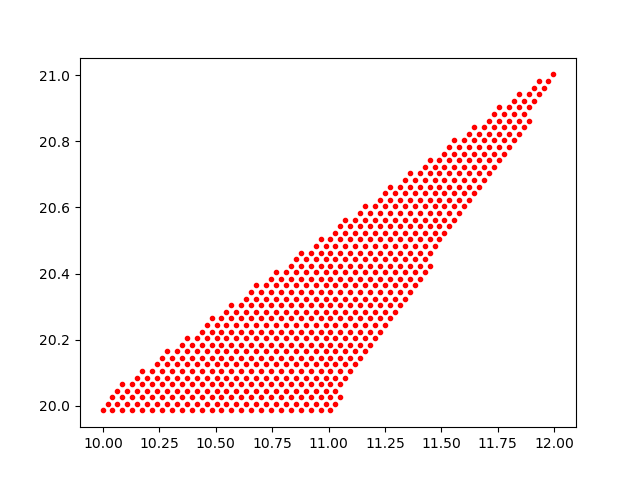
The HPGeom query_polygon() function behaves much the same as the healpy query_polygon().
It returns pixels whose centers lie within the convex polygon defined by the points listed if inclusive=False, or which overlap with the polygon if inclusive=True.
All edges of the polygon will be great circles.
A key difference is that hpgeom.query_polygon() takes as input spherical coordinates rather than unit-vector coordinates.
Note that this function is more efficient with nest ordering.
import hpgeom as hpg
import matplotlib.pyplot as plt


# Return all pixels within a triangle, including all pixels with
# with partial coverage.
pixels = hpg.query_polygon(
    2048,
    [10.0, 12.0, 11.0],
    [20.0, 21.0, 20.0],
    inclusive=True,
)
lon, lat = hpg.pixel_to_angle(2048, pixels)

plt.plot(lon, lat, 'r.')
plt.show()
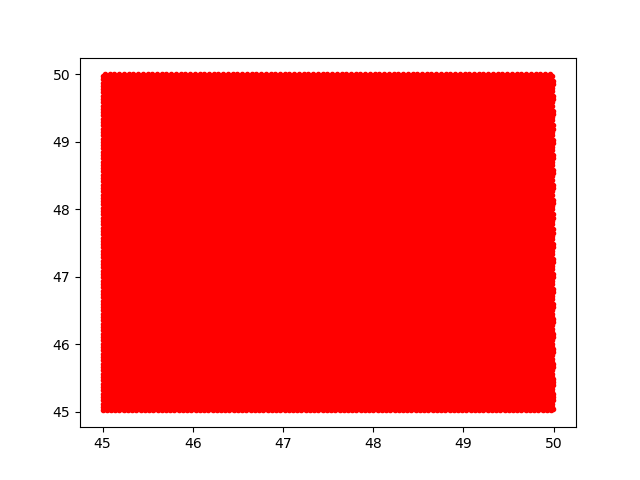
The HPGeom query_box() function does not have a direct analog in healpy.
This function returns pixels whose centers lie within a box if inclusive=False or which overlap with the box if inclusive=True.
The box is defined by all the points within [a0, a1] and [b0, b1].
The box will have boundaries in constant longitude/latitude, rather than great circle boundaries as with query_polygon().
If a0 > a1 then the box will wrap around 360 degrees.
If a0 == 0.0 and a1 == 360.0 then the box will contain points at all longitudes.
If b0 == 90.0 or b0 == -90.0 then the box will be an arc of a circle with the center at the north/south pole.
The box definition is derived from lsst-sphgeom.
import hpgeom as hpg
import matplotlib.pyplot as plt


pixels = hpg.query_box(2048, 45.0, 50.0, 45.0, 50.0)
lon, lat = hpg.pixel_to_angle(2048, pixels)

plt.plot(lon, lat, 'r.')
plt.show()
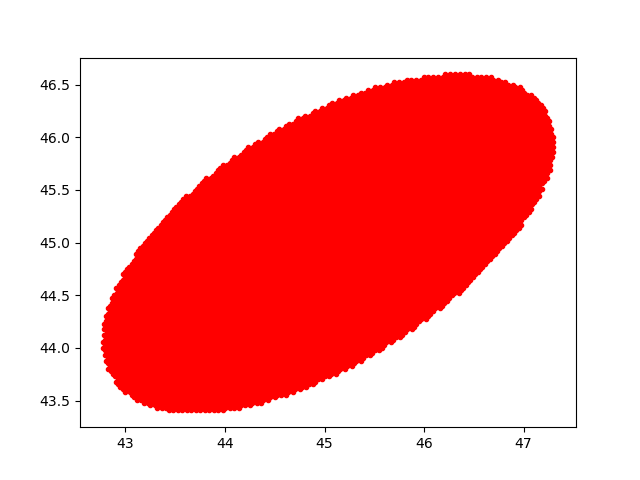
The HPGeom query_ellipse() function also does not have a direct analog in healpy.
This function returns pixels whose centers lie within an ellipse if inclusive=False or which overlap with the ellipse if inclusive=True.
The ellipse is defined by a center a, b and semi-major and semi-minor axes.
The inclination angle alpha is defined East of North.
The shape of the ellipse is defined by the set of points where the sum of the distances from a point to each of the foci add up to less than twice the semi-major axis.
Note that this method runs natively only with nest ordering.
If called with ring ordering then a ResourceWarning is emitted, and the pixel numbers will be converted to ring and sorted before output.
import hpgeom as hpg
import matplotlib.pyplot as plt


pixels = hpg.query_ellipse(2048, 45.0, 45.0, 2.0, 1.0, 45.0, inclusive=True)
lon, lat = hpg.pixel_to_angle(2048, pixels)

plt.plot(lon, lat, 'r.')
plt.show()
Pixel Boundaries and Neighbors
There are routines in HPGeom to compute pixel boundaries and neighbors.
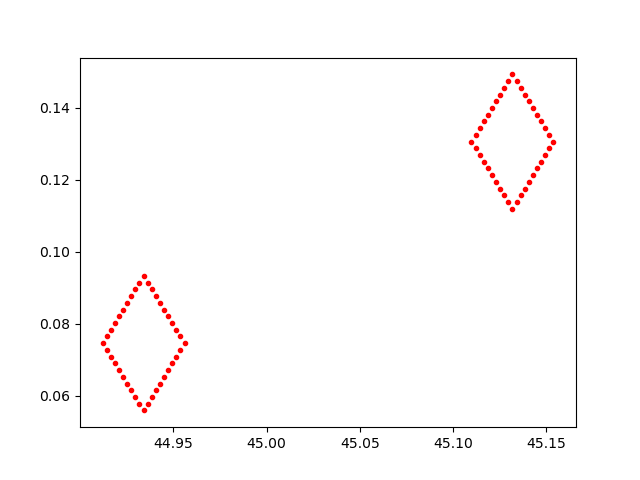
The HPGeom boundaries function behaves similarly to the healpy boundaries().
It returns a pair of arrays containing the longitude/latitude coordinate pairs describing the boundary of the specified pixel(s).
Unlike healpy, the HPGeom version returns positions rather than vectors.
Furthermore, the returned arrays have the shape (npixel, 4*step) (where step is the number of steps for each side of the pixel) rather than the equivalent transpose for healpy.
In order to get coordinates for just the corners of the specified pixels, specify step=1.
import hpgeom as hpg
import matplotlib.pyplot as plt


bounds_lon, bounds_lat = hpg.boundaries(2048, [10, 20], step=10)

plt.plot(bounds_lon, bounds_lat, 'r.')
plt.show()
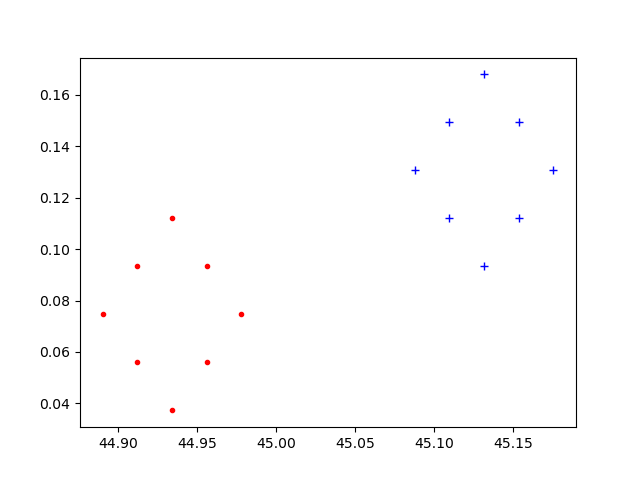
The HPGeom neighbors function is similar to healpy get_all_neighbours().
It returns the 8 nearest neighbors for the given list of pixels.
The returned array has the pixel ordering of SW, W, NW, N, NE, E, SE, and S neighbors.
If a neighbor does not exist (as can be the case for W, N, E, and S) the corresponding pixel number will be -1.
Note that the returned shape is (N, 8), which is the transpose of that returned by healpy.
import hpgeom as hpg
import matplotlib.pyplot as plt


neighbors = hpg.neighbors(2048, [10, 20])

lon, lat = hpg.pixel_to_angle(2048, neighbors)

plt.plot(lon[0, :], lat[0, :], 'r.')
plt.plot(lon[1, :], lat[1, :], 'b+')
plt.show()
The HPGeom get_interpolation_weights() function is the analog to healpy get_interp_weights().
It returns the four closest pixels and weights to perform bilinear interpolation along longitude and latitude.
As HPGeom does not handle full maps, it does not perform interpolation, but these weights are used by other code such as HealSparse to perform map interpolation.
As with the other routines, the returned ordering is (N, 4), a transpose of that returned by healpy.
import hpgeom as hpg


pixels, weights = hpg.get_interpolation_weights(2048, 12.234, 45.3445)
Multi-Threading Support
All HPGeom pixel conversion routines, as well as boundaries and weights, support multi-threading.
This can be turned on with the n_threads keyword.
If the array to be converted is small (the smallest chunk-size is 5000 computations) then the code will automatically fall back to single-threading because the overhead is not worth it.
However, for large arrays it is possible to approach x n_threads performance.
The query functions do not support multi-threading within HPGeom.
However, as they do not interface with Python directly, they do release the GIL and therefore multiple simultaneous queries are fully supported by Python multi-threading (via, e.g. concurrent.futures.ThreadPoolExecutor).
Healpy Compatibility Module
For ease of transitioning from healpy to HPGeom, a healpy compatibility module is provided.
This module contains interfaces to the HPGeom functionality that are identical to healpy, including all the same defaults (e.g. nest=False and lonlat=False).
All routines here are tested to return identical values to healpy.
import hpgeom.healpy_compat as hpc


pixels = hpc.ang2pix(2048, 0.0, 0.0)
theta, phi = hpc.pix2ang(2048, pixels)